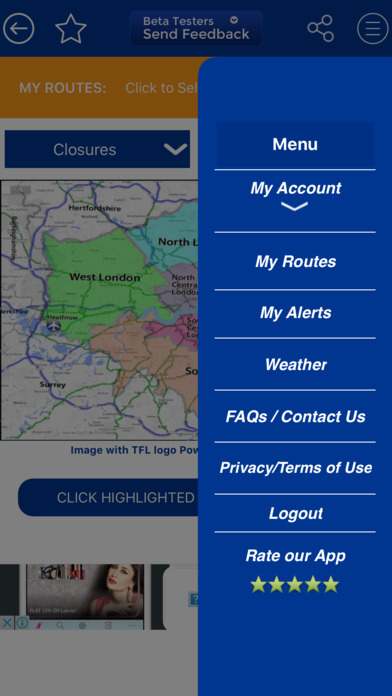
Live Traffic UK app for iPhone and iPad
Developer: Solutions XYZ LLC
First release : 09 Dec 2016
App size: 27.75 Mb
Get around London faster using 100s of near real-time videos & incident reports! Live Traffic UK allows you to quickly and easily see traffic conditions on roads across London – not with a still picture but a video, showing the volume AND speed of traffic.
Because of the clever way we’ve done it, you don’t live stream the videos so there’s no pixilation and it won’t eat up your data plan – in fact, most of our videos are under 200KB, just 1/10 the size of a photo.
Using the app is easy, and it lets you check your route, decide whether to seek an alternative, take a different transport mode or even wait until later to travel. Whatever happens, you’re more in control and more prepared. Videos are updated frequently, so you know the traffic information is right up to date.
The more people who use the app, the more demand on the roads is spread out, reducing congestion. So please tell your friends all about us, too.
This free app is so helpful, why wouldn’t you use it?
More background
Live Traffic UK is part of Live Traffic World which is focused on bringing the best quality traveller information to people on the roads. Live information is now in great demand, and ever-improving technologies are available to the vast and growing number of mobile users worldwide.
Having this information puts the power in the hands of the traveller and, in turn, they’re empowered to make decisions for themselves based on what they can see with their own eyes. On the navigation maps we all use, we generally know what green and yellow mean but no one really knows what red means. Is it typical rush hour traffic or is there a lorry lying on its side in the middle of the road? These are two VERY different scenarios, and you won’t know without being able to see - and hence, decide - for yourself. Also, current highway heat maps are statistically unreliable based upon our own independent testing. We found on average they could be inaccurate 25% of the time, meaning that often an area showing as red was not actually congested. This means there is no substitute for seeing it for ourselves.
By having this information, we know that drivers who see a jam on their journey will do their best to adjust to the situation by choosing a different route, or mode or time of travel.
Our future
We are dedicated not only to bringing this information to you but to helping agencies – from small towns to large cities – have the ability to generate valuable video updates by partnering with the best and most advanced technology companies.
The bottom line is the average person asking the question, “Can I get home the usual way or do I need to adjust my route or timing?” Our goal is to work with transport departments to bring you that information in an organised and user-friendly format.


